SEARCH


Developed by Iconsulting, an interactive map helps manufacturing companies to grasp the potential of Big Data for various needs
The strong digitization that has involved the manufacturing sector in recent years has led an increasing number of companies to adopt a data-driven approach.
A path that, however, is not always easy to implement.
Huge quantities of data are in fact produced daily by each departmental area of companies.
It is a real asset that requires skilful and expert management to generate value.
“Tech Champions to be”: two meetings for young talents

Real changes in all departments: from internal organization to the supply chain
The data usage in a strategic way it constitutes, in fact, the engine of a modern, competitive manufacturing able to face unpredictable market situations.
To enable data-driven initiatives within companies belonging to the manufacturing world, it is therefore essential to address real changes in all compartments, from internal organization to the supply chain.
Yet, it often appears complex to understand which solutions can be implemented to implement innovation.
Digital transformation: the barometer of Italian companies
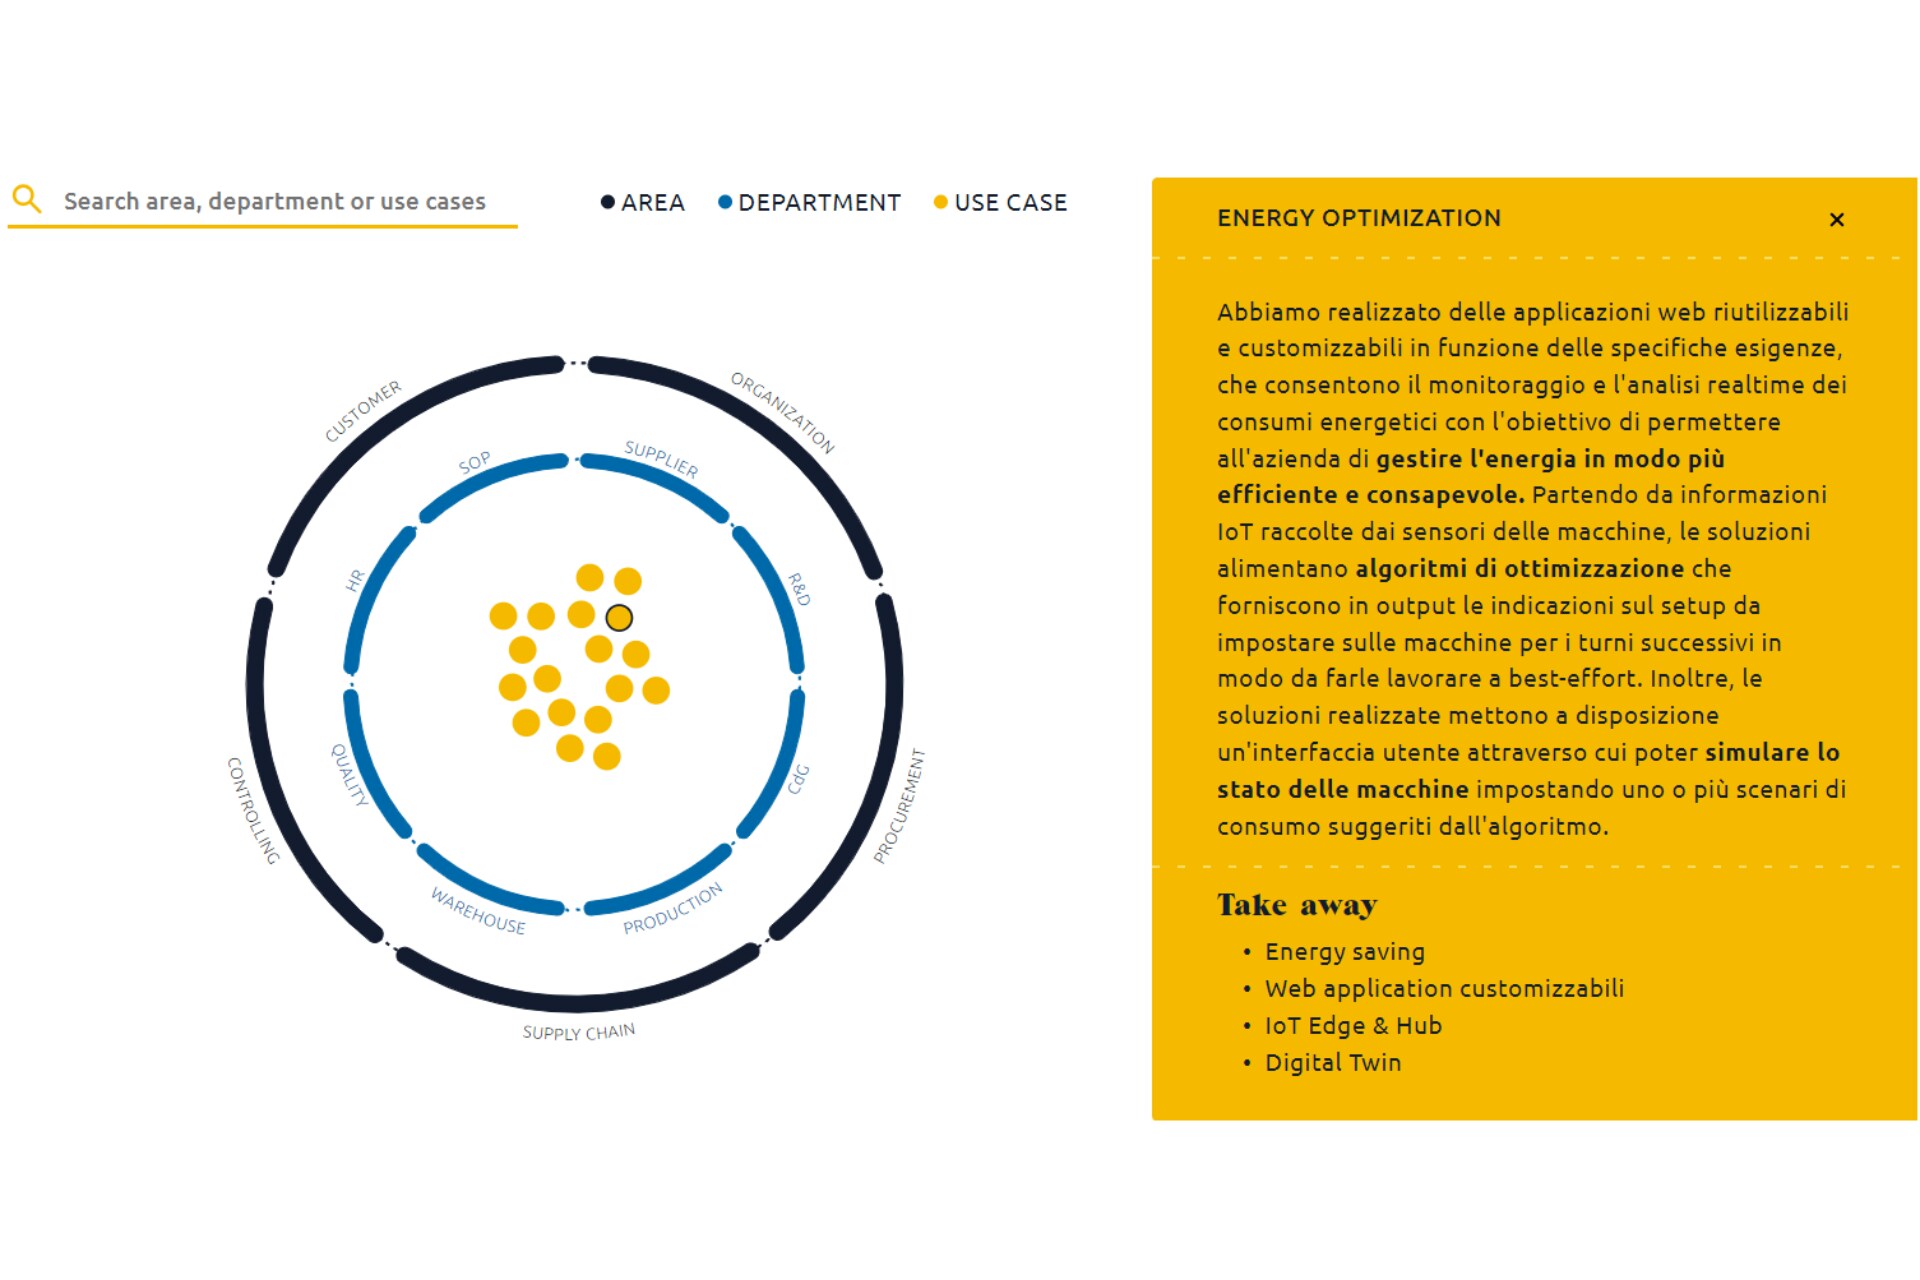
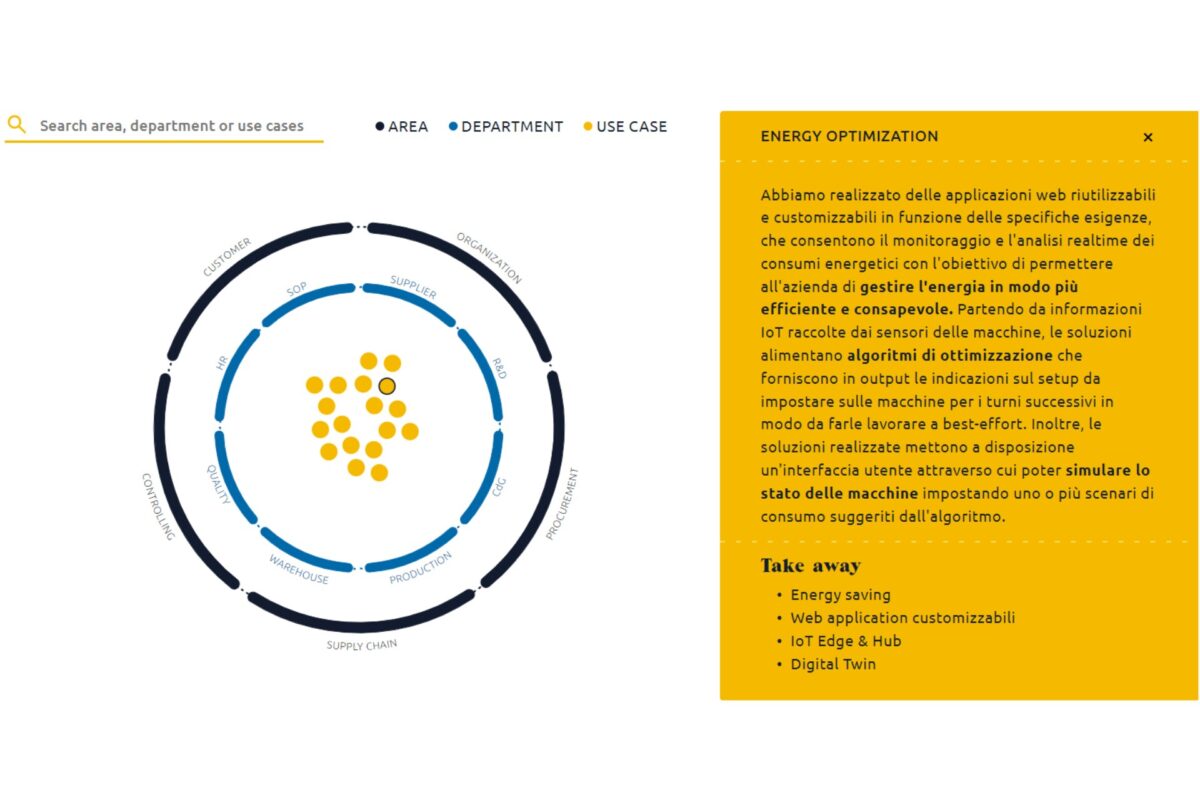
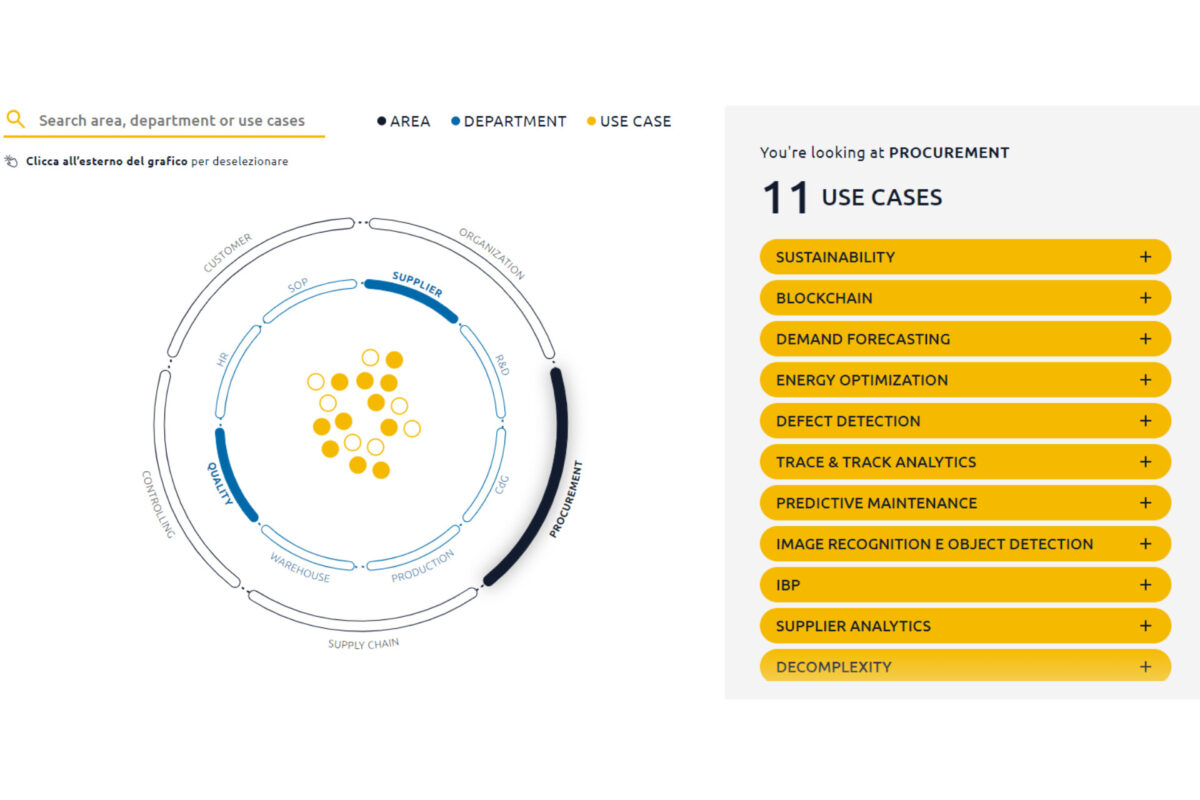
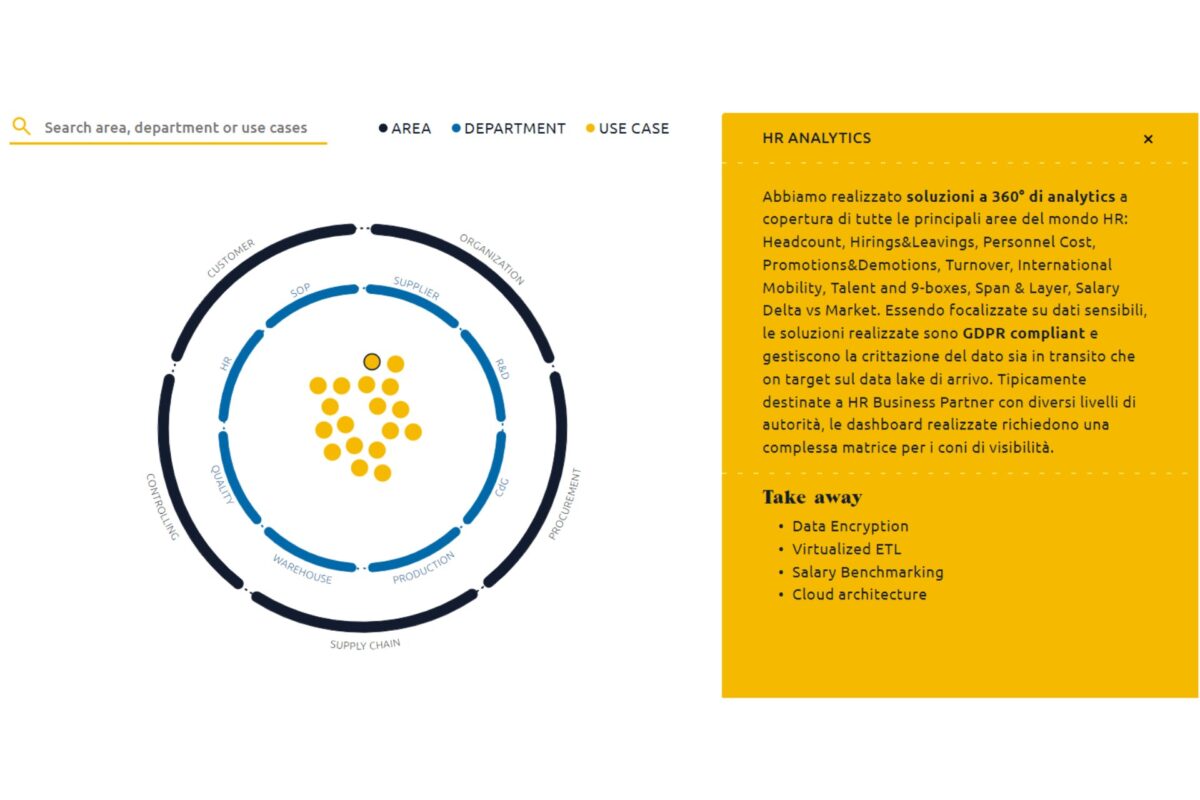
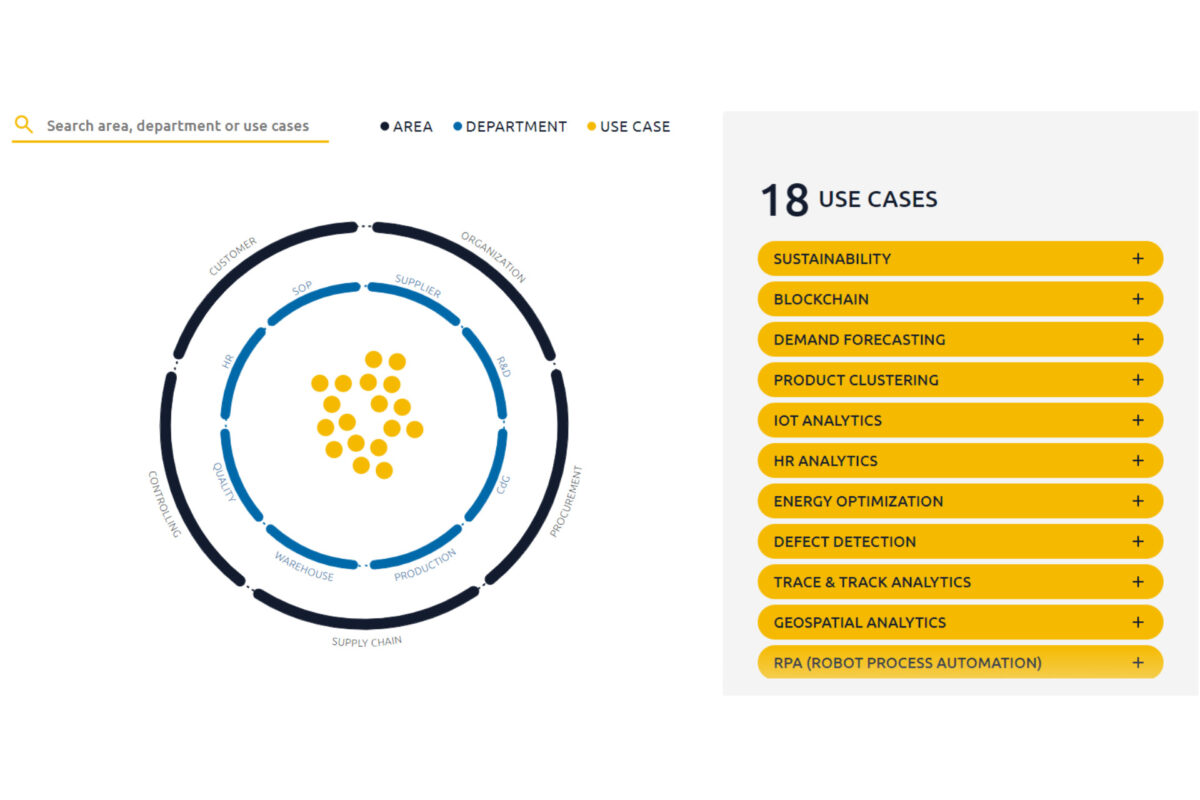
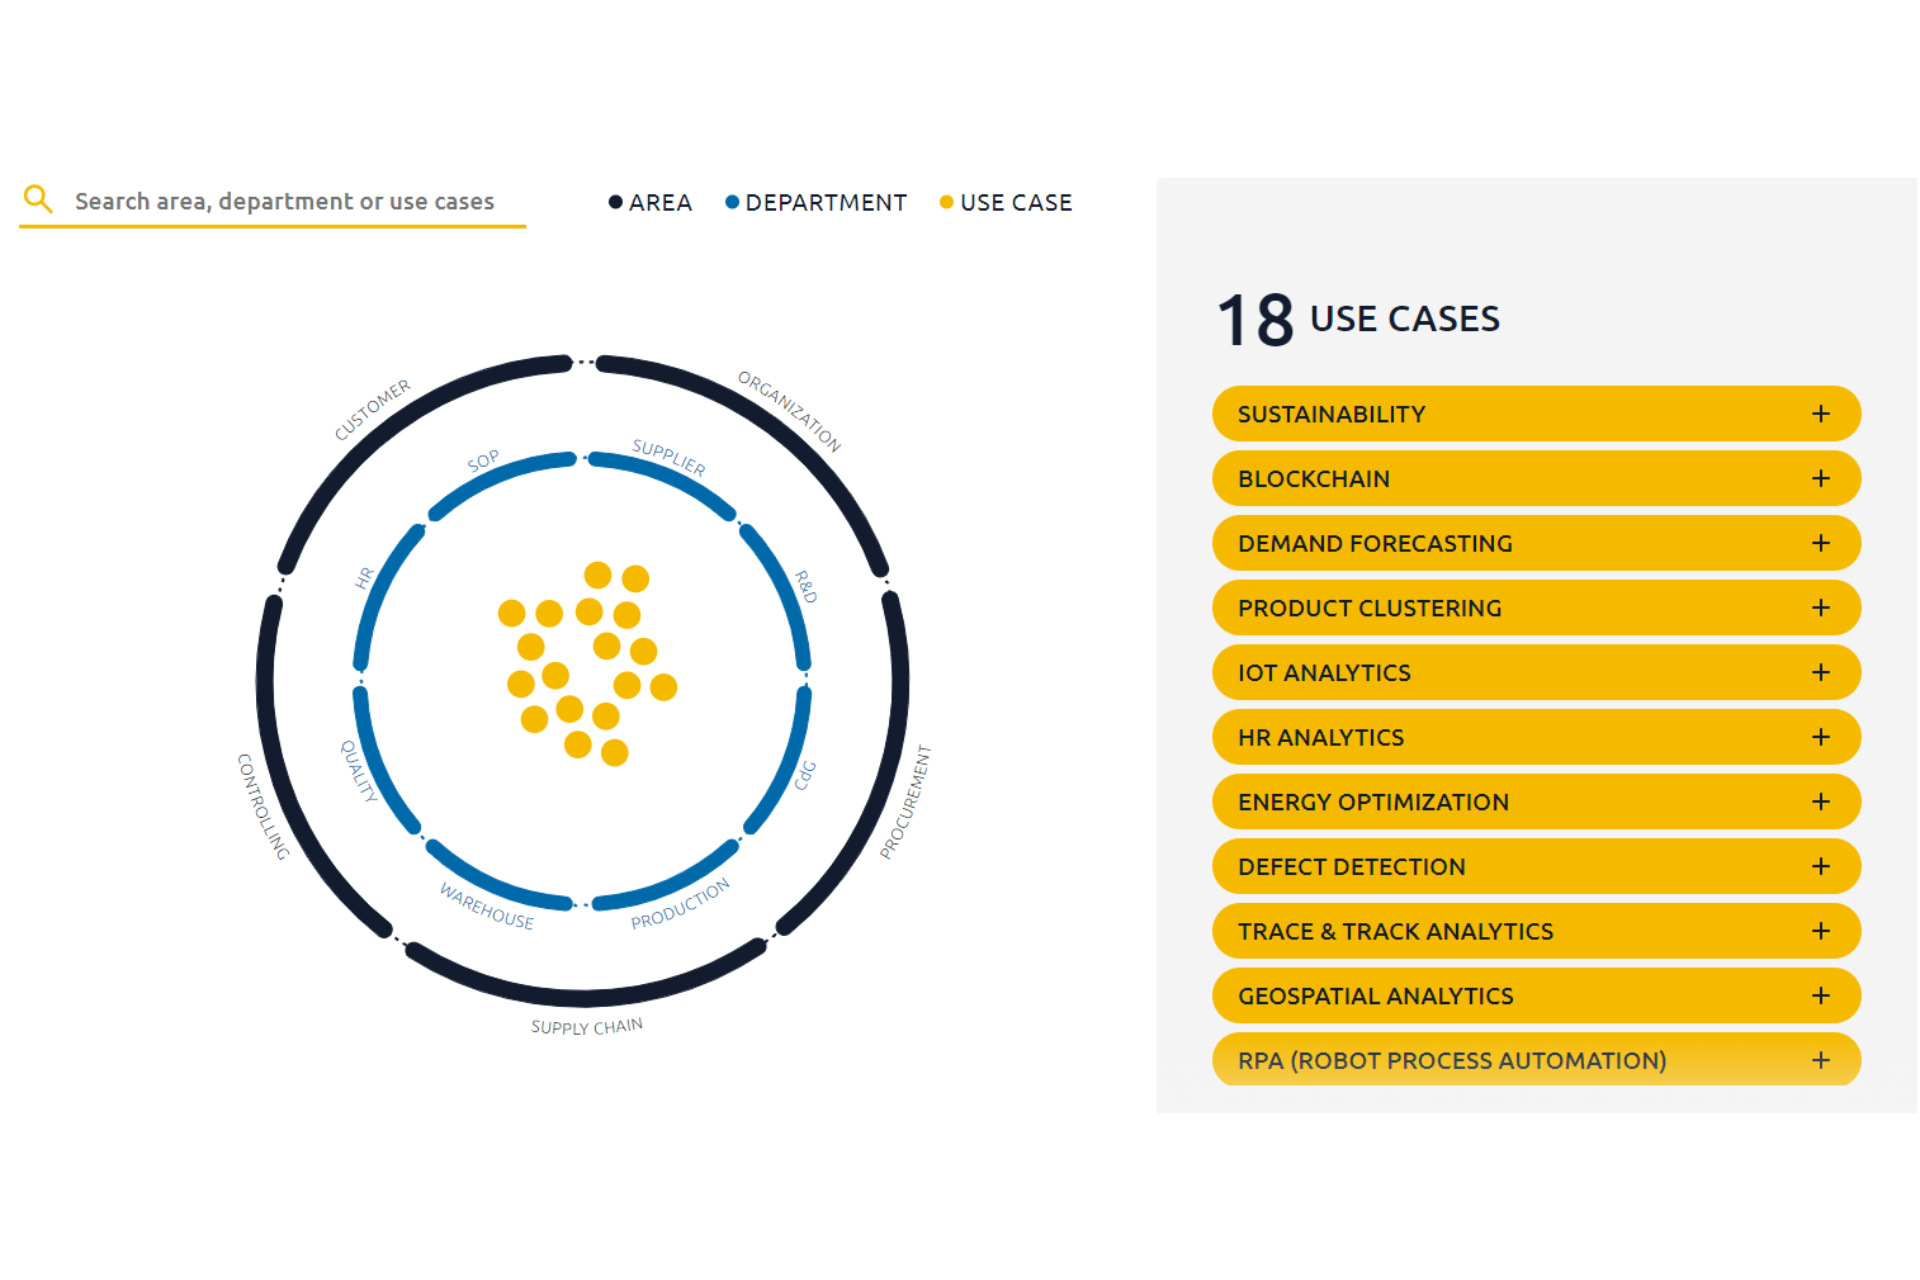
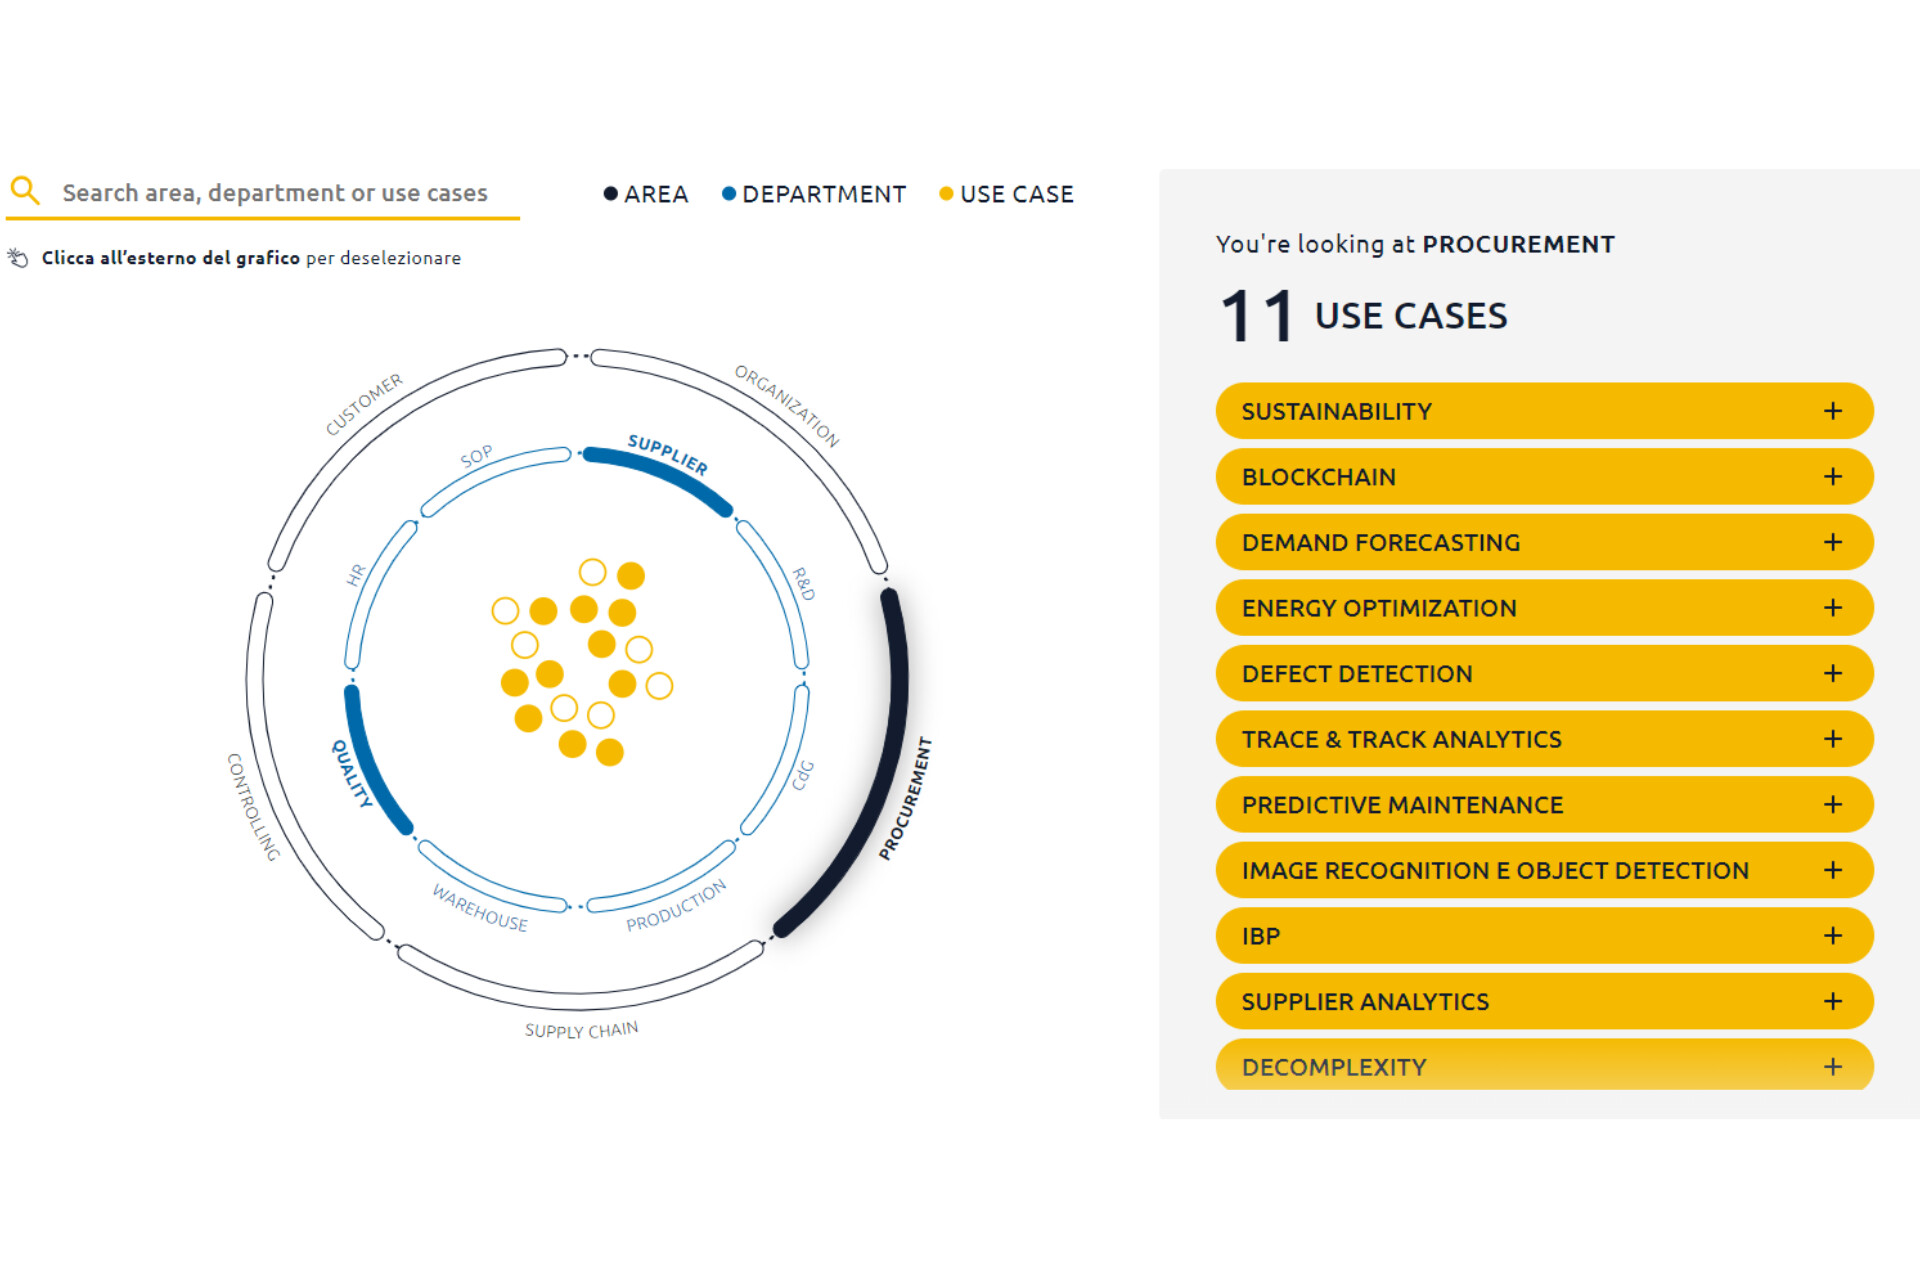
The Manufacturing Experience Map, created by Iconsulting, is an interactive widget that reveals how artificial intelligence and analytics can be decisive in data management, analyzing 5 areas (Organization, Procurement, Supply Chain, Controlling and Customer), 8 departments (Supplier, R&D , CdG, Production, Warehouse, Quality, HR, SOP) and 18 use cases
Artificial intelligence and analytics declined in 5 areas, 8 departments and 18 use cases
Into this scenario fits the Manufacturing Experience Map designed by Icon Consulting, the leading Italian consulting firm focused on strategic value creation starting from the data.
It is an interactive widget that reveals how artificial intelligence and analytics can be decisive for the future of every company in the manufacturing sector.
In fact, the Map analyzes 5 areas (Organization, Procurement, Supply Chain, Controlling and Customer), 8 departments (Supplier, R&D, CdG, Production, Warehouse, Quality, HR, SOP) and illustrates 18 use cases which, from Sustainability to Image Recognition, respond to the needs of the various divisions, revealing the strategies adopted and the results achievable.
The purpose of the tool is, therefore, to show the potential for action available to organizations that can count on data and to help them understand how to respond to different business needs through Iconsulting's development methodology and technology.
In Switzerland 16,8 billion francs invested in research by companies

Alfredo Formisano: "Clear and effective vision of the opportunities provided by technology"
"With the Manufacturing Experience Map we wanted to outline and share with the entire industry a clear and effective vision of the opportunities provided by data, technology and our methodology to promptly satisfy every business need", has explained Alfredo Formisano, Director of Icon Consulting.
"A tool which, based on use cases deriving from concrete and tangible experiences developed for our customers, offers cutting-edge solutions aimed at achieving the objective, contributing to progress and innovation".
AI and funnelling: the future of marketing automation is already written